Tuesday 15 October 2013

Executor With ConcurrentLinkedQueue

In this blog i will explore some of waiting strategy for inter thread communication.

BlockingQueue is integral part of many concurrency framework including ExecutorService of Java.

Some of concrete implementation of BlockingQueue are ArrayBlockingQueue , LinkedBlockingQueue.
These queues are extensively used for inter thread communication, one of the complex aspect of blocking queue is Waiting Strategy.

Some of Waiting Strategy
 - Sleep Based - This is most naive way, sometime it can be best fit
- Spin  Based - This is best when you know cost of context switch is more than spin, good fit if you have have free core available.

- Hybrid ( Spin & Sleep both) - Hope to get best of both world!

- Lock based - Classic wait/notify type, JDK 5 has simpler API to achieve this using Condition. Locks & Condition has has hidden all the complexity required for inter thread communication. It is used in ArrayBlockingQueue, LinkedBlockingQueue and many more place in JDK


ArrayBlockingQueue Vs LinkedBlockingQueue
Both type of queue is using lock based waiting strategy but ArrayBlockingQueue is must faster as compared LinkedBlockingQueue because it is using Array as the underlying data structure.

 - It does all the memory allocation up front, so little less work for GC.
 - Linear memory access as compared to LinkedList. I shared my finding with cache friendly linked list in linked-list-revisited-for-in-memory blog

Throughput of Queues
Lets look at Throughput numbers for some queues. In this test i add 50 Million message to queue and 1 Producer & 1 Consumer is used.

I am using 3 types of queue in this test
 - LinkedBlockingQueue
 - ArrayBlockingQueue
- ConcurrentLinkedQueue - This is Lock Free queue , it is interesting to see number of this queue,since this is not a blocking queue, so i will be using Spin based waiting strategy on consumer side
Another reason to include CLQ is  later i will be using different waiting strategy with this queue to make it blocking on consumer side.


Y Axis - Throughput in 100K/Second
X- Axis - Type of Queue


Numbers looks as expected, concurrent linked queue is best

Now i will add some proper wait strategy to ConcurrentLinkedQueue and measure performance
 - Lock Based  - This one is similar to what ArrayBlockingQueue is using
 - Park Based - This is custom wait strategy inspired from Conditions of Lock, it is bit different than Lock

  •  Don't have to acquire lock to use it, so that overhead is removed
  • Have to specify number of waiters, it is similar to Concurreny Level of Concurrent Hashmap, it will create slot for each waiter and that is used when thread is parked. In case if  no slots is available then thread is parked for some time.

Throughput  - Comparison


Y Axis - Throughput in 100K/Second
X- Axis - Type of Queue


Some description about labels
Con Spin - ConurrentLinkedQueue using Spin
Con Lock- ConurrentLinkedQueue using Lock (i.e using Condition)
Con Park- ConurrentLinkedQueue using explicit thread parking

ConcurrentLinkedQueue using Lock based strategy suffers , performance of the queue is similar to ArrayBlockingQueue, so definitely not is good idea to to use Locks because all the benifit of LockFree queue is gone as Locks are introduced.

The one using custom Park that i described above out performs, it is around 150% faster than ArrayBlocking & around 13% faster than Spin based concurrent queue.


Executors Using ConcurrentLinkedQueue
Park based strategy which is like Condtions in JDK but without overhead of Lock seems better choice, but before we conclude anything , lets look at another test result.

I performed test on Executors by using different types of queue(ArrayBlockingQueue,ConcurrentBlocking With Park)
I also included WorkStealingPool to test which is included in JDK 8.

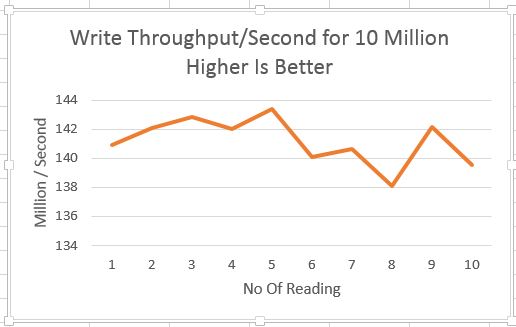
In this test 1 Million message is added by each producer to ExecutorService and slowly number of producer & threads in executor is increased.


Executor using ConcurrentLinkedQueue with Park Wait strategy seems best and in some case it is better than ForkJoinPool especially when number of Producer are increased.

Conclusion
Waiting strategy is complex, different use case might need different strategy to get best performance. This blog shows one of strategy which seems better than Lock based strategy that we have in JDK.

Code is available @ github

Sunday 22 September 2013

Linked List Revisited for In Memory computing

Linked list is one of the first data structure that you learn when you start reading about data structure.
Linked List has its own advantage over other data structure like array, just to recap few of them

Some benefit of Linked List
 - Insert cost is low, just update address of new node
 - Memory Allocation cost is very low because it has to just allocate one node and attach it to last node
 - Very good data structure when you don't know how much data you will be storing, it grow on need basis, no wastage of space
 - Very low overhead when element is removed.

Things that are not good about Linked List
 - Access by Index is bad and not recommended .

  - Creates lot of work for Garbage Collector, can result in frequent Minor GC due which young objects will be promoted early to old generation

  - Extra Node Object is required for each element , so total memory required is (Node+Value) * No Of Objects. This can become problem if there is lot of objects.

 - Random memory access because of the way nodes are linked, this is major draw back because random memory walk is slow as compared to linear walk, CPU does lot of hard work to optimized memory access but Linked List or Tree based Data Structure can't use all those optimization due to random memory walk.
On NUMA based machine it become worse.


Do we need Linked List now ?
That is really tough question to answer, but the way Linked List performs it looks like it has no space in Data Structure Library.

With the current In-Memory trend, where application is keeping all the data in memory and data structure like Linked List are not friendly for that.

Lets Tweak Linked List for today requirement.
So today we need Linked List that has advantage of both Linked List & Array, that way we can get best of both world.

For testing i will create MultiValueLinkedList that has feature of both array & linked list. So it is like each Node contains small Array List and all these nodes are linked.
So you can say Array List linked via Linked List.

For performance test i add some millions of items in Linked List/MultiValueLinkedList/Array List and iterate over it. I start with 10 Million element and increase it by 5 Million.


Add Performance 
Lets look at some numbers for add operation in different types of list


X Axis - Time taken for add in Ms
Y Axis - No of Element added in Millions

MultiValueLinkedList is clear winner in this test, it is around 22X times faster than Linked List.

Linked List performance is so bad that graph scale is screwed up and it is difficult to make out difference between MultiValueLinkedList & Array List, so i will put another graph for MultiValueLinkedList & Array List

ArrayList Vs MultiValueLinkedList

This graph gives better understanding of performance of Array List & MultiValueLinkedList, new linked list is 2.7X times faster than Array List.

 Iterate Performance
Look at iterate performance before i try to explain reason of performance boost


X Axis - Time taken for iterate/access in Ms
Y Axis - No of Element in Millions

As i said earlier that new Linked List will be hybrid one , it will take best from Linked List & Array List and this graph confirms that , it is somewhere in between Linked List & Array List.
MultiValueLinkedList is around 1X times faster than linked list

Garbage Collections
This test is all about allocation and will not be completed without GC activity graph, i want to put more GC observation but that will make this blog big, so i will put just one Visual GC graph

Visual GC Graph for Linked List

Visual GC Graph for MultiValueLinkedList


I don't have to explain much in these GC behavior, for Linked List minor GC activity is so much that object are promoted to old generation, all though it is not required.
GC behaves as expected for MultiValueLinkedList.

Observation
 - Performance of add is best for MultiValueLinkedList & it is due to less number of allocation & almost no need to copy the Array as it is required for Array List whenever it grows

 - Garbage produced by MultiValueLinkedList is very less. Memory usage of MultiValueLinkedList is same as ArrayList & for LinkedList it is double, that explains why we see object promotion to old generation.

- Iteration of MultiValueArrayList is slow as compared to Array List because memory access pattern is like Page by Page, it is possible to improve it further but adjusting the size of element in nodes.

Code is available @ github

Saturday 14 September 2013

Concurrent Counter With No False Sharing

This blog is continuation of Scalable Counter post.

One of the reader shared result from his system. He ran test on XEON intel processor with 16 core and total time taken for each type of counter is almost same, although Atomic counter has CAS failure & other type does't has any CAS failure but it does't make any difference in execution time.
Very strange result , needs further investigation.

Another reader pointed out that it could be due to false sharing, so it worth to take that into account and i created another class that handles FALSE SHARING

Time take by different counter
 Y Axis - Time taken to increment 1 Million times

X Axis - Number of threads

PaddedAtomicCounter is new type of counter that i have added to test & it it outperforms all other counters.
It is using cache line padding to avoid false sharing.
Cacheline is of 64 byte on most of the today processor. PaddedCounter it Integer based counter so it is adding 16 slot per counter, by using this techniques we avoid cache pollution & as result we see 16X times gain as compared to AtomicCounter, without padding the gain was 5X and with cache line padding gain jumps to 16X.
With cacheline padding you need some extra space, so it is trade off of memory for speed, you can choose what you want!

CAS failure rate
Lets look at the CAS failure for different counter & what it means for performance.


Y Axis - CAS Failure in 100Ks

X Axis - Number of threads

PaddedAtomic has some CAS failure as compared to other counters , but it does't make any difference in execution time of the counter.
CAS failure is not the only factory that can determined execution time, false sharing make significant contribution to it, so this gives good explanation of behavior seen in XEON processor

Conclusion
To get better performance you have to take care of few things

 -  Contention  - There are many techniques to avoid it , this blogs shows one of them

 -    False Sharing - You have to avoid false sharing to get best out of processor, padding is required for that. Some of the JDK classes are using padding are ThreadLocalRandom , now we have @Contended annotation from java to achive same thing, it is being used in ForkAndJoinPool

Code is available @ github


Tuesday 10 September 2013

Scalable Counters For Multi Core

Counters are required everywhere , for e.g. to find key KPI of application, load on application, total number of request served, some KPI for finding throughput of application & many more.

With all these requirement complexity of concurrency is also added & that makes this problem interesting.

How to implement concurrent counter

 - Synchronized - This was the only option before JDK 1.5, since now we are waiting for JDK8 release , so definitely this is not an option.

- Lock based  - You should never attempt this for counter , it will perform very badly

- Wait Free - Java does't have support for Fetch-and-add, so bit difficult to implement it.

- Lock free - With very good support of Compare-and-swap, this looks good option to use.

How does Compare-and-Swap based counter performs

I used AtomicInteger for this test and this counter is incremented for 1 Million time by each thread & to increase the contention number of threads are increased gradually.

Test Machine Details
OS : Windows 8
JDK : 1.7.0.25
CPU : Intel i7-3632QM , 8 Core
RAM : 8 GB


Y Axis - Time taken to increment 1 Million times

X Axis - Number of threads

As number of threads are increased, time taken to increment counter increases and it is due to contention.
For CAS based counter , it is CAS failure that causes slowdown.

Is this best performance that we can get ? no definitely their are better solution to implement concurrent counter, lets have look at them.

Alternate Concurrent Counter
Lets look at some of the solution to implement counter that handles contention in better way

- Core Based Counter - Maintain counter for each logical core, so that way you will have less contention. Only issue you have this type of counter is that if number of threads are more than logical core then you will start noticing contention.

- Thread Based Counter - Maintain counters for total number of threads that will be using system. This works well when number of threads are more than number of logical cores.


Lets test it

Time taken by different types of counter


Y Axis - Time taken to increment 1 Million times

X Axis - Number of threads

Concurrent Counter performs much better than Atomic based counter, for 16 threads it is around 5X times better, that is huge difference!

CAS Failure Rate

Y Axis - CAS Failure in 100Ks

X Axis - Number of threads

Due to contention, Atomic based counter see lot of failure and it goes up exponential as i add more threads & other counters performs pretty well.

Observation
  Multi core machines becoming easily available & we have to change the way we handle concurrency, traditional way of doing concurrency is not going to scale in today's time when having 24 or 48 core server is very common.

 - To reduce the contention you have to use multiple counters and then aggregate them later

 - Core based counter works well if number of threads will be less or same as number of cores

 - Thread based counter is good when number of threads are much more than available core

 - Key to reduce contention is identify counter to which thread will write,i have used simple approach based on thread id, but much better approach are available, look at ThreadLocalRandom of JDK 8 for some ideas.

 - Thread based approach is used in LongAdder of JDK8, which creates many slots to reduce contention.

Code for all the counters used in this test are available @ Github

Thursday 25 July 2013

Which memory is faster Heap or ByteBuffer or Direct ?

Java is becoming new C/C++ , it is extensively used in developing High Performance System.
Good for millions of Java developer like me:-)

In this blog i will share my experiment with different types of memory allocation that can be done in java and what type of benefit you get with that.


Memory Allocation In Java
What type of support Java provide for memory allocation

 - Heap Memory
I don't i have to explain this, all java application starts with this.  All object allocated using "new" keyword goes under Heap Memory

- Non Direct ByteBuffer
It is wrapper over byte array, just flavor of Heap Memory.
ByteBuffer.allocate() can be used to create this type of object, very useful if you want to deal in terms of bytes not Object.

 - Direct ByteBuffer
This is the real stuff that java added since JDK 1.4.
Description of Direct ByteBuffer based on Java Doc

"A direct byte buffer may be created by invoking the allocateDirect factory method of this class. The buffers returned by this method typically have somewhat higher allocation and deallocation costs than non-direct buffers. The contents of direct buffers may reside outside of the normal garbage-collected heap, and so their impact upon the memory footprint of an application might not be obvious. It is therefore recommended that direct buffers be allocated primarily for large, long-lived buffers that are subject to the underlying system's native I/O operations. In general it is best to allocate direct buffers only when they yield a measureable gain in program performance."

Important thing to note about Direct Buffer is 
 - It is Outside of JVM
 - Free from Garbage Collector reach.

These are very important thing if you care about performance.
MemoryMapped file are also flavor of Direct byte buffer, i shared some of my finding with that in below blogs

arraylist-using-memory-mapped-file
power-of-java-memorymapped-file

- Off Heap or Direct Memory
This is almost same as Direct ByteBuffer but with little different, it can be allocated by unsafe.allocateMemory, as it is direct memory so it creates no GC overhead. Such type of memory must be manually released.

In theory Java programmer are not allowed to do such allocation and i think reason could be
 - It is complex to manipulate such type of memory because you are only dealing with bytes not object
 - C/C++ community will not like it :-)

Lets take deep dive into memory allocation

For memory allocation test i will use 13 byte of message & it is broken down into
 - int - 4 byte
 - long - 8 byte
 - byte - 1 byte

I will only test write/read performance, i am not testing memory consumption/allocation speed.

Write Performance


X Axis - No Of Reading
Y Axis - Op/Second in Millions


5 Million 13 bytes object are written using 4 types of allocation.
Direct ByteBuffer & Off Heap are best in this case, throughput is close to 350 Million/Sec
Normal ByteBuffer is very slow, TP is just 85 Million/Sec
Direct/Off Heap is around 1.5X times faster than heap


I did same test with 50 Million object to check how does it scale, below is graph for same.


X Axis - No Of Reading
Y Axis - Op/Second in Millions


Numbers are almost same as 5 Million.

Read Performance

Lets look at read performance


X Axis - No Of Reading
Y Axis - Op/Second in Millions


This number is interesting, OFF heap is blazing fast throughput for 12,000 Millions/Sec :-)
Only close one is HEAP read which is around 6X times slower than OFF Heap.

Look at Direct ByteBuffer , it is tanked at just 400 Million/Sec, not sure why it is so

Lets have look at number for 50 Million Object

X Axis - No Of Reading
Y Axis - Op/Second in Millions


Not much different.

Conclusion
Off heap via Unsafe is blazing fast with 330/11200 Million/Sec.
Performance for all other types of allocation is either good for read or write, none of the allocation is good for both.
Special note about ByteBuffer, it is pathetic , i am sure you will not use this after seeing such number.
DirectBytebuffer sucks in read speed, i am not sure why it is so slow

So if memory read/write is becoming bottle neck in your system then definitely Off-heap is the way to go, remember it is highway, so drive with care.

Code is available @ git hub

Update
Fixing broken code link - code available at github

Saturday 20 July 2013

ArrayList Using Memory Mapped File

Introduction
In-Memory computing is picking up due to affordable hardware, most of the data is kept in RAM to meet latency and throughput goal, but keeping data in RAM create Garbage Collector overhead especially if you don't pre allocate.
So effectively we need garbage less/free approach to avoid GC hiccups

Garbage free/less data structure
There are couple of option to achieve it
 - Object Pool 
Object pool pattern is very good solution, i wrote about that in Lock Less Object Pool blog

- Off Heap Objects
JVM has very good support for creating off-heap objects. You can get rid of GC pause if you take this highway and highway has its own risk!

-MemoryMapped File
This is mix of Heap & Off Heap, like best of world.

Memory mapped file will allow to map part of the data in memory and that memory will be managed by OS, so it will create very less memory overhead in JVM process that is mapping file.
This can help in managing data in garbage free way and you can have JVM managing large data.
Memory Mapped file can be used to develop IPC, i wrote about that in power-of-java-memorymapped-file blog

In this blog i will create ArrayList that is backed up by MemoryMapped File, this array list can store millions of object and with almost no GC overhead. It sounds crazy but it is possible.

Lets gets in action
In this test i use Instrument object that has below attribute
 - int id
 - double price

So each object is of 12 byte.
This new Array List holds 10 Million Object and i will try to measure writer/read performance

Writer Performance


X Axis - No Of Reading
Y Axis - Time taken to add 10 Million in Ms


Adding 10 Million element is taking around 70 Ms, it is pretty fast.

Writer Throughput
Lets look at another aspect of performance which is throughput


X Axis - No Of Reading
Y Axis - Throughput /Second , in Millions


Writer throughput is very impressive, i ranges between 138 Million to 142 Million

Reader Performance

X Axis - No Of Reading
Y Axis - Time taken to read 10 Million in Ms


It is taking around 44 Ms to read 10 Million entry, very fast. With such type of performance you definitely challenge database.

 Reader Throughput

X Axis - No Of Reading
Y Axis - Throughput /Second , in Millions


Wow Throughput is great it is 220+ million per second

It looks very promising with 138 Million/Sec writer throughput & 220 Million/Sec reader throughput.

Comparison With Array List
Lets compare performance of BigArrayList with ArrayList,

Writer Throughput - BigArrayList Vs ArrayList


 Throughput of BigArrayList is almost constant at around 138 Million/Sec, ArrayList starts with 50 Million and drops under 5 million.

ArrayList has lot of hiccups and it is due to 
 - Array Allocation
 - Array Copy
 - Garbage Collection overhead

BigArrayList is winner in this case, it is 7X times faster than arraylist.

Reader Throughput - BigArrayList Vs ArrayList

ArrayList performs better than BigArrayList, it is around 1X time faster.

BigArrayList is slower in this case because
 - It has to keep mapping file in memory as more data is requested
 - There is cost of un-marshaling

Reader Throughput for BigArrayList is 220+ Million/Sec, it is still very fast and only few application want to process message faster than that.
So for most of the use-case this should work.

Reader performance can be improved by using below techniques 
 - Read message in batch from mapped stream
 - Pre-fetch message by using Index, like what CPU does

By doing above changes we can improve performance by few million, but i think for most of the case current performance is pretty good

Conclusion
Memory mapped file is interesting area to do research, it can solve many performance problem.
Java is now being used for developing trading application and GC is one question that you have to answer from day one, you need to find a way to keep GC happy and MemoryMapped is one thing that GC will love it.

Code used for this blog is available @ GitHub , i ran test with 2gb memory.
Code does't handle some edge case , but good enough to prove the point that that MemoryMapped file can be winner in many case.

Sunday 7 July 2013

How To Write Micro benchmark In Java

So many article has been written on how to write micro-bench mark in java, this blog is my attempt to explain the topic.

What is Micro benchmark
Micro benchmark try to measure actual speed of small piece of code, measuring performance is very complex because JIT does magic to make code fast and you have to measure the code after all the JIT optimization is done.

What factors should be considered for benchmark 
Some of the factors that you should consider for correct bench-marking are

  • Warm-up phase - This is to start measuring only after JIT has compiled hot code, JIT will compile functions only after 10K invocation.
  • Client vs Server - Running JVM in client or server mode will give different performance result
  • GC  - Garbage Collector makes measurement really difficult 
  • Re-compilation effect - Code executing first time will be slow
More details are available @ MicroBenchmarks Rules

How to write micro benchmark
This can be very difficult to write but not to worry, now there are some framework available to do that
 - Caliper  - It is Google solution for writing benchmark
 - JMH   - This one is from java guys, in this blog i will explain some of example using JMH

How to use JMH
JMH is maven based project but don't know the reason why it is not hosted on maven central.
You need TortoiseHg to download code, once you have the code then it is cake walk to setup/build the JMH project.
Refer to Setup page for detail instruction on setup.

Lets look at some examples
As every programming language starts with hello world, so does JHM .
JMH has used annotation based approach to specify which function you want to run as part of benchmark,  GenerateMicroBenchmark annotation is used for that.

-Empty function 
JVM is complex piece of software and it has some overhead, having empty function checks that overhead
Numbers that come outs with this test are 

Run result "wellHelloThere": 2893313.782 ▒(95%) 118441.448 ▒(99%) 161902.046 ops
/msec
Run statistics "wellHelloThere": min = 2388762.991, avg = 2893313.782, max = 310
8116.404, stdev = 253075.135
Run confidence intervals "wellHelloThere": 95% [2774872.334, 3011755.229], 99% [
2731411.736, 3055215.827]

This is interesting number, if you have some empty function then it can be called 2.8 million times per mili second, that is very fast.

JHM does all the magic and shows number that we are interested in. JMH is based on code generation, it generate lots of code to measure performance, all the generated code is available under "generated-sources"

Have look at generated file

That is lot of code!

-Benchmark modes
JHM has benchmark modes, very useful, it has most of the mode that you can think of for eg
 - Throughput
- AverageTime
 - SampleTime - Time distribution, percentile estimation
- SingleShotTime

I must say very well thought of by java team.

-States
This is very common use case , this test measure overhead of shared object vs per thread object. Result are interesting.
Run result "measureUnshared": 1264160.208 (95%) 20349.174 (99%)
Run result "measureShared": 965178.728 (95%) 20847.118 (99%)

Unshared test is around 30% fast as compared to shared & it is due to contention on memory .

-DeadCode
This benchmark measure effect of dead code, very common case.
Lets look at sample code
Results are interesting in this case, JVM is very smart enough to remove dead code from call and time take for function as good as there is no call to log function.

-Constant Folding
This is another interesting optimization that is done by compiler,Constant folding techniques will optimize call to functions that takes constant parameter,sometime this can result in tricky defects.
Way to avoid trap is read inputs via some state. Lets have look at sample code

measureWrong function is faster because JVM performs optimization based on constant folding rules, but be very cautious this an cause some defect in you code!

-Multiple Implementation
This is very interesting test, this test has multiple implementation of counter interface, code is same but just 2 implementation and result are random, you can't conclude why one implementation fast as compared to other.

JVM will mix profile of two test and due to which result are random. JMH has option to measure this type of test properly, there is annotation Fork that will execute benchmark in new JVM.

- Compile Control
JMH has support to measure effect of inline, no inline, exclude compile. These things are really useful to find performance number under different scenario. Sample benhmark for compile control

- Asymmetric
JMH has very good support for asymmetric execution for eg producer/consumer, in traditional test we have to write thread related code to make this happen, but JMH has declarative way of specifying such behavior, multiple benchmark methods can be grouped by using Group annotation.
Sample code for grouping.

Conclusion
JHM is very useful tool for micro bench marking, it is worth spending time to move some of the performance test of application to JHM.
Writing benchmark will give very good understanding of how JVM works.

Sunday 16 June 2013

Fast ReadWrite Lock


Locks are bad for performance, but still they are good fit for some scenario.

In this post i will review java Read/Write lock and alternate implementation of fast Read/Write lock 

What is Readers-Writer lock
Lets do quick re-cap of read/write lock.

As name suggest it is shared lock , it is shared between readers/writers. So you can have either reader(s) or writer. You can have multiple readers or one writer active at any given point of time. So it is very good fit for the case where number of read operation is more than write.

What is the issue with Java RW lock
By design only reader(s) or writer can be active at any given point of time, so it will cause starvation when contention is high

Advance RW lock will have additional features like
  • Priority -   for eg writer has more priority than readers or otherwise
  • Fairness  - This can be based on waiting time
It is complex to build lock with these set of rules and many things are in control of OS, for eg scheduling of thread.
With all these issues rw locks are still used.

How does RW lock perform.
Lets try to measure rw lock performance under different scenario

Details of problem that will be used for testing

Read/Write to Hashmap, writer threads adds 1 Million entry to map and reader tries to read those value back, for write operation Write lock is used and for read operation Read lock is used.
I will try to test java rw lock under no-contention and gradually try to increase contention to see how it performs.

Legend to read graph

1W - One writer
1W-1R - One writer & One reader
1W-2R - One write & Two reader 

Writer Performance


X Axis - Writer/reader Threads
Y Axis - Time to 1 Milli entry


Case when there is "1 Writer & 1 Reader" shows wired number on my system, i will ignore that for comparison.

When there is no contention writer takes around 73 ms and as we add more reader threads contention increases, it starts to slow down, in my example when total thread count reaches to 4 performance drops by 10 times. That is big drop for "1Writer-3Reader" scenario, just think what will happen if more readers are added.

Writer Throughput
Lets have look at throughput


X Axis - Writer/reader Threads
Y Axis - Throughput/Sec


I will ignore case "1W-1R" 

Throughput also takes big hit under contention, it falls from sky to roof, for 1 writer throughput is 14 million and once total thread count reaches to 4 throughput drops to 1.4 million which is 90% less.

Writer is just one part of RW lock, lets look at  the performance of reader.

Reader Performance

X Axis - Writer/reader Threads
Y Axis - Time to add 1 Million entry


Performance degrade trend continues in readers also.

Reader Throughput

Reader throughput also takes hit under contention.


Readers without writer contention
This scenario is very realistic because 

  • Mostly writer thread will populate data at application start up time
  • Or based on some write event to update data incrementally

90% + times application only reads the data and it is the performance of readers threads that will matter most by the end of day. Lets have look at performance when only readers are active.


In this test data in hashmap was pre-populated and only readers threads were executing.
Numbers now looks real :-) . 

It takes more time to read data as number of readers increase, same thing is observed for throughput also, it drops.

Alternate Reader/Writer Lock
Lets compare alternate implementation of RW lock

Readers without writer contention

Fast Lock outperforms java ReadWriteLock in both the test. 

In the first test, time taken to read is almost flat with Fast RW Lock and for java based it is going up like stock price as we keep on adding more readers thread. 

In throughput test java rw lock starts from 28 million and it drops to 1.6 million, that is 95% drop.
Fast rw lock starts from 58 million and drops to 34 million, that is around 40% drop.

Under heavy contention(i.e 4 readers), java readerwriter lock is around 20X times slow, that looks like comparing apple vs orange, but test result shows that.

So for readers new lock looks great, lest measure with writer.

 Writer Performance - Java RW vs Fast RW

Fastlock performs better than java RW lock under contentions 

Reader Performance - Java RW vs Fast RW


What makes FastRW lock fast
Now lets understand why new read/write lock is fast.

RW lock that i have used for testing is an implementation of SeqLock. SeqLock is very common in linux world, it provide parallelism for readers & writer. Reader never blocks writer & reader uses optimistic approach to read the data.

Readers in seqlock never update any sate in ReadWrite lock and thus reduces cpu cache traffic,so just load operation is involved for reading data.

So in nutshell it provides 

  • Less cpu cache traffic  
  • Readers never block writer
  • Reader never changes state of lock, no expensive store operation
  • Readers can slow down if write frequency is very high
  • Writer always get priority 


With so much of benefit i am sure you will never use java RW lock!

Conclusion 
SeqLock are very good alternative for reader/writer lock and especially in multicore world where we are use new technique to get best out of processor. Someday java will add support for seqlock.
Code is available @ GitHub for your reference.

Sunday 9 June 2013

CPU cache access pattern

Things to know about low latency

If you are developing low latency application then you have to remove bottleneck that can cause your latency to increase, some of the bottleneck that comes to my mind

 - Input/Output - I/O has big effect in latency it will cause CPU to stall. SSD disk may be one option, but still you want to keep this out of core processing logic.

 - Network - Same effect as I/O, so you have to reduce Network read/write in your core logic, there are many software and hardware solution to improve this.

- Locks in code - Using non-blocking techniques.

- Keeping data in RAM - I will explore this option in blog.

So we can keep all data in RAM to get best latency possible. RAM is very cheap, so lets put every thing in RAM. In theory you should be able to keep CPU busy if all the data that you need for computing is available in RAM, but in practical it doesn't happen that way because of underlying datastructure used.
CPU stalls for some time due to slow access of RAM.

Experiment
Lets try simple experiment to prove that keeping all data in RAM is just not enough to achieve low latency.

Problem:
25 million instrument object are stored in memory and each object has 2 attribute
 - Instrument Id
 - Price 
Sets of input price is passed as input and all the instrument matching that price will be returned. It is a simple search based on price attribute.

Structure Of Instrument Object
Two types of instrument object is created for this test.

 - As simple java object
Instrument object is simple java class with 2 attribute

 class Instrument
{
public int id;
private int price;
public Instrument(int id, int price) {
super();
this.id = id;
this.price = price;
}

public int getId() {
return id;
}

public int getPrice() {
return price;
}
}

- Column type object
For each attribute array is created, this structure is more CPU cache friendly, we will why is is so later.
Sample ColumnInstrument Object

 class ColumnInstrumentStore
{

private int[] ids;
private int[] prices;

public ArrayInstrumentStore(int size)
{
ids = new int[size];
prices = new int[size];
}


public int getId(int index) {
return ids[index];
}


public int getPrice(int index) {
return prices[index];
}
public void setValue(int index, int id, int price) {
ids[index] = id;
prices[index] = price;
}

}

Lets measure performance
Lets try to measure search cost for 2 types of instrument object,

 X axis - No of reading
 Y axsis - Time taken in Ms

Linear search is performed on 25 million instrument object.
Instrument object defined as column is around 5% to 25% faster as compared to normal java based instrument object, on average it is 15% faster as compared to java based object.

Lets look at another number - Time take for each iteration. Time taken for 1 iteration is very less so i have used nano second to measure that.


 X axis - No of reading
 Y axis - Time taken in NanoSecond

This explains why search on column based objects is fast, time spent per iteration is around 15% less .

Why Column based object is fast
Lets look at the reason why search performs better on Column layout type of object as compared to normal object.

 - CPU Pre-Fetching - Today almost all the processor supports hardware pre-fetch. CPU pre-fetch data that is required by application to reduce memory latency

 - Better use of CPU cache - CPU moves data from main memory to cache via cache lines, in current generation of CPU, cache line is of 64 byte, so if you ask for 1 byte of data, processor will still bring 64 byte of data from ram to CPU cache line. This is called - Spatial locality, definition from wikipedia -

Spatial locality: if a particular memory location is referenced at a particular time, then it is likely that nearby memory locations will be referenced in the near future. In this case it is common to attempt to guess the size and shape of the area around the current reference for which it is worthwhile to prepare faster access

This CPU behavior can be used to reduce round trip to ram by co-locating you data.

Lets take Instrument object to understand layout

- Object Layout


- Column Layout


In case of column based instrument, data is stored in integer array, if program request for single value of array , it will get next 15 element of array due to cache line transfer, but in case of normal object it will get only 7 instrument price.
Normal object layout requires double round trip to memory and that is the reason why it is slow.
If you co locate your objects then you can use CPU cache much more efficiently.

Most of the real object are more complex than Instrument object that i have used and you can imagine number of round trip it require to RAM.
You can get more details of memory latency from latency-number-that-you-should-know
Just to put those number in context -

L1 Cache : 0.5 ns
Main Memory  : 100 ns ( 20x times more than L1)


How it performs in multi-threaded world.
In today's time it is impossible to get machine with single core, we live in multi core world!
Each logical core has its own private cache, so if you data structure is cache friendly then it will scale linearly as you add more threads/core to your processing.

Lets look at some number for multi threaded search.

Search latency


Loop Iteration

Both search & iteration per second is improving as more number of threads are added, this will become more effective for NUMA machines because memory access is not uniform.

Just by having CPU cache friendly layout you can improve application performance
Column layout have more benefit, more on next blog.

Sunday 19 May 2013

Lock Less Java Object Pool

It is being while i wrote anything, i has been busy with my new job that involve doing some interesting work in performance tuning. One of the challenge is to reduce object creation during critical part of application.

Garbage Collection hiccups has been main pain point in java for some time, although java has improved over time with GC algorithmic. Azul is market leader developing pause less GC but Azul JVM are not free as speech!

Creating too many temporary/garbage object does't work too well because it create work for GC and it is going to have effect on latency, too much garbage also does't work well with multi core system because it causes cache pollution.

So how should we fix this ?

Garbage less coding
This is only possible if you know how many object you need upfront and pre-allocate them, but in reality that is very difficult to find that , but in-case if you still managed to do that then you have to worry about another issue

  • You might not have enough memory to hold all the object you need
  • You have to handle concurrency
So what is the solution for above problem
There is Object Pool design pattern that can address both of the above issue,it lets you to specify num of object that you need in pool and handles concurrent request to serve object request.

Object Pool has been base of many application that has low latency requirement, flavor of object pool is Flyweight design pattern.

Both of above pattern will help us in avoiding object creation, that is great so now GC work is reduced and in theory our application performance should improve but in practical does't happen that way because Object Pool/Flyweight has to handle concurrency and  whatever advantage you get by avoiding object creation is lost because of concurrency issue.

What are most common way to handle concurrency
Object pool is typical producer/consumer problem and it can be solved by using following techniques 

Synchronized - This was the only way to handle concurrency before JDK 1.5, apache has written wonder full object pool API based on synchronized 

Locks   - Java added excellent support for concurrent programming since JDK 1.5, there has been some work to use Locks to develop Object Pool for eg furious-objectpool

Lock Free - I could not find any implementation that is built using fully lock free technique, but furious-objectpool use mix of ArrayBlocking queue & ConcurrentLinked queue

Lets measure performance
In this test i have created pool of 1 Million object and those object are accessed by different pool implementation, objects are taken from pool and return back to pool.

This test first starts with 1 thread and then number of threads are increased to measure how different pool implementation perform under contention


.
X Axis - No Of Threads
Y Axis - Time in Ms - Lower time is better

This test include pool from Apache, Furious Pool & ArrayBlocking based Pool

Apache one is worst and as number of threads increase performance degrades further and reason for same is Apache pool is based on heavy use of "synchronized" 

Other two Furious & ArrayBlocking based pool performs better but both of them also slows down as contention increase. 

ArrayBlocking queue based pool takes around 1000 ms for 1 Million items when 12 threads are trying to access the pool, Furious pool which internally uses Arrayblocking queue takes around 1975 ms for same thing. 

I have to do some more detail investigation to find out why Furious is taking double time because it is also based on ArrayBlocking queue.

Performance of arrayblocking queue is decent but it is lock based approach, what type of performance we can get if we can implement lock free pool.

Lock free pool.
Implementing lock free pool is not impossible but bit difficult because you have to handle multiple producer & consumer.

I will implement hybrid pool which will use lock on the producer side & non blocking technique on the consumer side.

Lets have look some numbers 

I performed same test with new implementation (FastPool) and it is almost 30% faster than ArayBlocking queue.

30% improvement is not bad, it can definitely help is meeting latency goal.

What makes Fast Pool fast!
I used couple of technique to make it fast
  • Producer are lock based - Multiple producer are managed using locks, this is same as Array Blocking queue, so nothing great about this.


  • Immediate publication of released item - it publishes element before lock is released using cheap memory barrier. This gives some gain


  • Consumer are non blocking - CAS is used to achieve this, consumer are never blocked due to producer. Array Blocking queue blocks consumer because it use same lock for producer & consumer


  • Thread Local to maintain value locality -  Thread Local is used to acquire last value that was used, this reduces contention to great extent. 
If you are interested in having look at code then it is available @ FastObjectPool.java